| sfdp_layout | Obtain the SFDP spring-block layout of the graph. |
| fruchterman_reingold_layout | Calculate the Fruchterman-Reingold spring-block layout of the graph. |
| arf_layout | Calculate the ARF spring-block layout of the graph. |
| random_layout | Performs a random layout of the graph. |
| graph_draw | Draw a graph to screen or to a file using cairo. |
| graphviz_draw | Draw a graph using graphviz. |
| prop_to_size | Convert property map values to be more useful as a vertex size, or edge width. |
| cairo_draw | Draw a graph to a cairo context. |
| interactive_window | Display an interactive GTK+ window containing the given graph. |
| GraphWidget | Interactive GTK+ widget displaying a given graph. |
| GraphWindow | Interactive GTK+ window containing a GraphWidget. |
Obtain the SFDP spring-block layout of the graph.
| Parameters : | g : Graph
vweight : PropertyMap (optional, default: None)
eweight : PropertyMap (optional, default: None)
pin : PropertyMap (optional, default: None)
groups : PropertyMap (optional, default: None)
C : float (optional, default: 0.2)
K : float (optional, default: None)
p : float (optional, default: 2)
theta : float (optional, default: 0.6)
max_level : int (optional, default: 11)
gamma : float (optional, default: 1.0)
mu : float (optional, default: 0.0)
mu_p : float (optional, default: 1.0)
init_step : float (optional, default: None)
cooling_step : float (optional, default: 0.9)
adaptive_cooling : bool (optional, default: True)
epsilon : float (optional, default: 0.1)
max_iter : int (optional, default: 0)
pos : PropertyMap (optional, default: None)
multilevel : bool (optional, default: None)
coarse_method : str (optional, default: "hybrid")
mivs_thres : float (optional, default: 0.9)
ec_thres : float (optional, default: 0.75)
weighted_coarse : bool (optional, default: False)
verbose : bool (optional, default: False)
|
|---|---|
| Returns : | pos : PropertyMap
|
Notes
This algorithm is defined in [hu-multilevel-2005], and has complexity \(O(V\log V)\).
References
| [hu-multilevel-2005] | (1, 2) Yifan Hu, “Efficient and High Quality Force-Directed Graph”, Mathematica Journal, vol. 10, Issue 1, pp. 37-71, (2005) http://www.mathematica-journal.com/issue/v10i1/graph_draw.html |
Examples
>>> g = gt.price_network(3000)
>>> pos = gt.sfdp_layout(g)
>>> gt.graph_draw(g, pos=pos, output="graph-draw-sfdp.pdf")
<...>
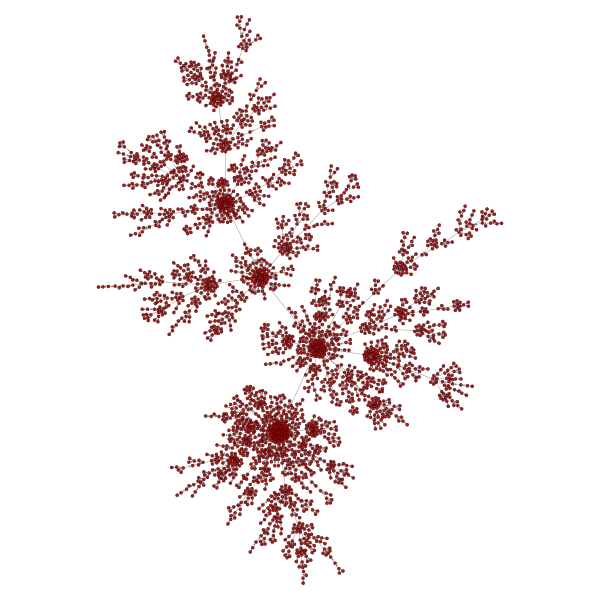
SFDP layout of a Price network.
Calculate the Fruchterman-Reingold spring-block layout of the graph.
| Parameters : | g : Graph
weight : PropertyMap (optional, default: None)
a : float (optional, default: \(V\))
r : float (optional, default: 1.0)
scale : float (optional, default: \(\sqrt{V}\))
circular : bool (optional, default: False)
grid : bool (optional, default: True)
t_range : tuple of floats (optional, default: (scale / 10, scale / 1000))
n_iter : int (optional, default: 100)
pos : PropertyMap (optional, default: None)
|
|---|---|
| Returns : | pos : PropertyMap
|
Notes
This algorithm is defined in [fruchterman-reingold], and has complexity \(O(\text{n-iter}\times V^2)\) if grid=False or \(O(\text{n-iter}\times (V + E))\) otherwise.
References
| [fruchterman-reingold] | (1, 2) Fruchterman, Thomas M. J.; Reingold, Edward M. “Graph Drawing by Force-Directed Placement”. Software - Practice & Experience (Wiley) 21 (11): 1129-1164. (1991) DOI: 10.1002/spe.4380211102 |
Examples
>>> g = gt.price_network(300)
>>> pos = gt.fruchterman_reingold_layout(g, n_iter=1000)
>>> gt.graph_draw(g, pos=pos, output="graph-draw-fr.pdf")
<...>
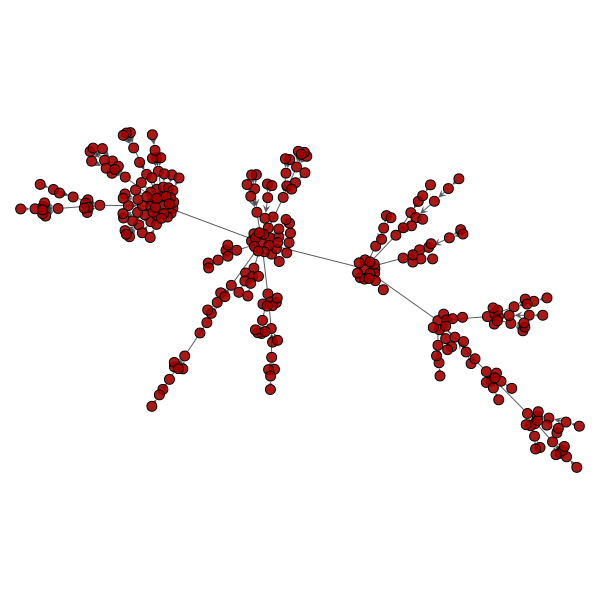
Fruchterman-Reingold layout of a Price network.
Calculate the ARF spring-block layout of the graph.
| Parameters : | g : Graph
weight : PropertyMap (optional, default: None)
d : float (optional, default: 0.5)
a : float (optional, default: 10)
dt : float (optional, default: 0.001)
epsilon : float (optional, default: 1e-6)
max_iter : int (optional, default: 1000)
pos : PropertyMap (optional, default: None)
dim : int (optional, default: 2)
|
|---|---|
| Returns : | pos : PropertyMap
|
Notes
This algorithm is defined in [geipel-self-organization-2007], and has complexity \(O(V^2)\).
References
| [geipel-self-organization-2007] | (1, 2) Markus M. Geipel, “Self-Organization applied to Dynamic Network Layout”, International Journal of Modern Physics C vol. 18, no. 10 (2007), pp. 1537-1549, DOI: 10.1142/S0129183107011558, arXiv: 0704.1748v5 |
Examples
>>> g = gt.price_network(300)
>>> pos = gt.arf_layout(g, max_iter=0)
>>> gt.graph_draw(g, pos=pos, output="graph-draw-arf.pdf")
<...>
ARF layout of a Price network.
Performs a random layout of the graph.
| Parameters : | g : Graph
shape : tuple or list (optional, default: None)
pos : PropertyMap (optional, default: None)
dim : int (optional, default: 2)
|
|---|---|
| Returns : | pos : PropertyMap
|
Notes
This algorithm has complexity \(O(V)\).
Examples
>>> g = gt.random_graph(100, lambda: (3, 3))
>>> shape = [[50, 100], [1, 2], 4]
>>> pos = gt.random_layout(g, shape=shape, dim=3)
>>> pos[g.vertex(0)].a
array([ 68.72700594,   1.03142919,   2.56812658])
Draw a graph to screen or to a file using cairo.
| Parameters : | g : Graph
pos : PropertyMap (optional, default: None)
vprops : dict (optional, default: None)
eprops : dict (optional, default: None)
vorder : PropertyMap (optional, default: None)
eorder : PropertyMap (optional, default: None)
nodesfirst : bool (optional, default: False)
output_size : tuple of scalars (optional, default: (600,600))
fit_view : bool (optional, default: True)
output : string (optional, default: None)
fmt : string (default: "auto")
vertex_* : PropertyMap or arbitrary types (optional, default: None)
edge_* : PropertyMap or arbitrary types (optional, default: None)
**kwargs :
|
|---|---|
| Returns : | pos : PropertyMap
selected : PropertyMap (optional, only if output is None)
|
Notes
| Name | Description | Accepted types | Default Value |
|---|---|---|---|
| shape | The vertex shape. Can be one of the following strings: “circle”, “triangle”, “square”, “pentagon”, “hexagon”, “heptagon”, “octagon” “double_circle”, “double_triangle”, “double_square”, “double_pentagon”, “double_hexagon”, “double_heptagon”, “double_octagon”, “pie”. Optionally, this might take a numeric value corresponding to position in the list above. | str or int | "circle" |
| color | Color used to stroke the lines of the vertex. | str or list of floats | [0., 0., 0., 1] |
| fill_color | Color used to fill the interior of the vertex. | str or list of floats | [0.640625, 0, 0, 0.9] |
| size | The size of the vertex, in the default units of the output format (normally either pixels or points). | float or int | 5 |
| aspect | The aspect ratio of the vertex. | float or int | 1.0 |
| anchor | Specifies how the edges anchor to the vertices. If 0, the anchor is at the center of the vertex, otherwise it is at the border. | int | 1 |
| pen_width | Width of the lines used to draw the vertex, in the default units of the output format (normally either pixels or points). | float or int | 0.8 |
| halo | Whether to draw a circular halo around the vertex. | bool | False |
| halo_color | Color used to draw the halo. | str or list of floats | [0., 0., 1., 0.5] |
| halo_size | Relative size of the halo. | float | 1.5 |
| text | Text to draw together with the vertex. | str | "" |
| text_color | Color used to draw the text. If the value is "auto", it will be computed based on fill_color to maximize contrast. | str or list of floats | "auto" |
| text_position | Position of the text relative to the vertex. If the passed value is positive, it will correspond to an angle in radians, which will determine where the text will be placed outside the vertex. If the value is negative, the text will be placed inside the vertex. If the value is -1, the vertex size will be automatically increased to accommodate the text. | float or int | -1 |
| font_family | Font family used to draw the text. | str | "serif" |
| font_slant | Font slant used to draw the text. | cairo.FONT_SLANT_* | cairo.FONT_SLANT_NORMAL |
| font_weight | Font weight used to draw the text. | cairo.FONT_WEIGHT_* | cairo.FONT_WEIGHT_NORMAL |
| font_size | Font size used to draw the text. | float or int | 12 |
| surface | The cairo surface used to draw the vertex. If the value passed is a string, it is interpreted as an image file name to be loaded. | cairo.Surface or str | None |
| pie_fractions | Fractions of the pie sections for the vertices if shape=="pie". | list of int or float | [0.75, 0.25] |
| pie_colors | Colors used in the pie sections if shape=="pie". | list of strings or float. | ('b','g','r','c','m','y','k') |
| Name | Description | Accepted types | Default Value |
|---|---|---|---|
| color | Color used to stroke the edge lines. | str or list of floats | [0.179, 0.203,0.210, 0.8] |
| pen_width | Width of the line used to draw the edge, in the default units of the output format (normally either pixels or points). | float or int | 1.0 |
| start_marker, mid_marker, end_marker | Edge markers. Can be one of “none”, “arrow”, “circle”, “square”, “diamond”, or “bar”. Optionally, this might take a numeric value corresponding to position in the list above. | str or int | -1 |
| marker_size | Size of edge markers, in units appropriate to the output format (normally either pixels or points). | float or int | 4 |
| control_points | Control points of a Bézier spline used to draw the edge. | sequence of floats | [] |
| dash_style | Dash pattern is specified by an array of positive values. Each value provides the length of alternate “on” and “off” portions of the stroke. The last value specifies an offset into the pattern at which the stroke begins. | sequence of floats | [] |
| text | Text to draw next to the edges. | str | "" |
| text_color | Color used to draw the text. | str or list of floats | [0., 0., 0., 1.] |
| text_distance | Distance from the edge and its text. | float or int | 4 |
| text_parallel | If True the text will be drawn parallel to the edges. | bool | True |
| font_family | Font family used to draw the text. | str | "serif" |
| font_slant | Font slant used to draw the text. | cairo.FONT_SLANT_* | cairo.FONT_SLANT_NORMAL |
| font_weight | Font weight used to draw the text. | cairo.FONT_WEIGHT_* | cairo.FONT_WEIGHT_NORMAL |
| font_size | Font size used to draw the text. | float or int | 12 |
Examples
>>> g = gt.price_network(1500)
>>> deg = g.degree_property_map("in")
>>> deg.a = 4 * (sqrt(deg.a) * 0.5 + 0.4)
>>> ebet = gt.betweenness(g)[1]
>>> ebet.a /= ebet.a.max() / 10.
>>> eorder = ebet.copy()
>>> eorder.a *= -1
>>> pos = gt.sfdp_layout(g)
>>> control = g.new_edge_property("vector<double>")
>>> for e in g.edges():
...     d = sqrt(sum((pos[e.source()].a - pos[e.target()].a) ** 2)) / 5
...     control[e] = [0.3, d, 0.7, d]
>>> gt.graph_draw(g, pos=pos, vertex_size=deg, vertex_fill_color=deg, vorder=deg,
...               edge_color=ebet, eorder=eorder, edge_pen_width=ebet,
...               edge_control_points=control, # some curvy edges
...               output="graph-draw.pdf")
<...>
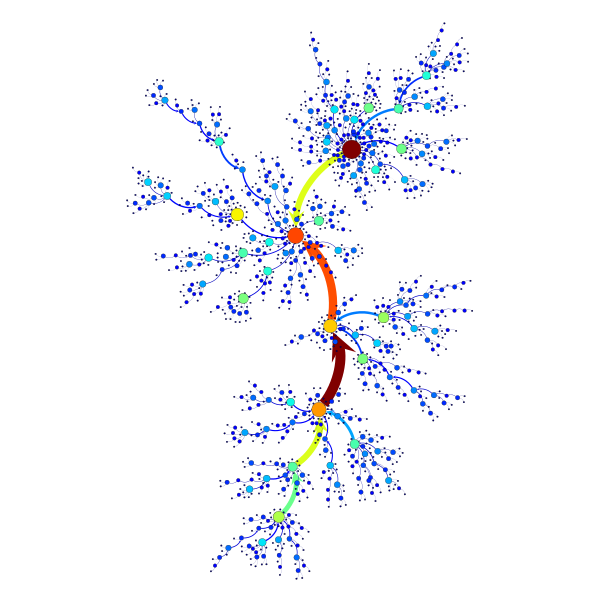
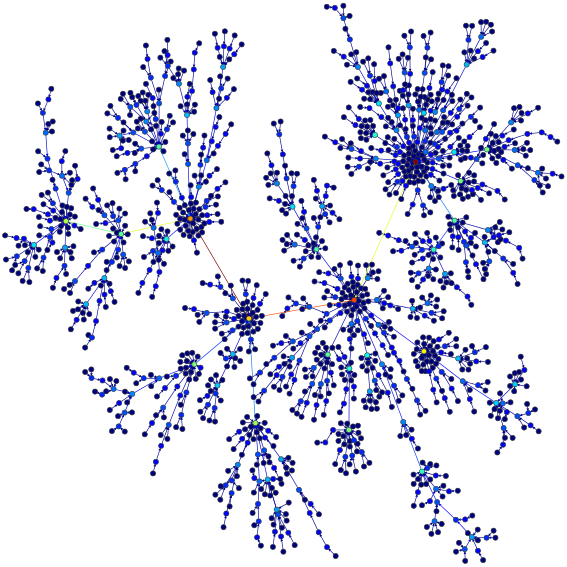
SFDP force-directed layout of a Price network with 1500 nodes. The vertex size and color indicate the degree, and the edge color and width the edge betweeness centrality.
Draw a graph using graphviz.
| Parameters : | g : Graph
pos : PropertyMap or tuple of PropertyMap (optional, default: None)
size : tuple of scalars (optional, default: (15,15))
pin : bool or PropertyMap (default: False)
layout : string (default: "neato" if g.num_vertices() <= 1000 else "sfdp")
maxiter : int (default: None)
ratio : string or float (default: "fill")
overlap : bool or string (default: "prism")
sep : float (default: None)
splines : bool (default: False)
vsize : float, PropertyMap, or tuple (default: 0.105)
penwidth : float, PropertyMap or tuple (default: 1.0)
elen : float or PropertyMap (default: None)
gprops : dict (default: {})
vprops : dict (default: {})
eprops : dict (default: {})
vcolor : string or PropertyMap (default: "#a40000")
ecolor : string or PropertyMap (default: "#2e3436")
vcmap : matplotlib.colors.Colormap (default: matplotlib.cm.jet)
vnorm : bool (default: True)
ecmap : matplotlib.colors.Colormap (default: matplotlib.cm.jet)
enorm : bool (default: True)
vorder : PropertyMap (default: None)
eorder : PropertyMap (default: None)
output : string (default: "")
output_format : string (default: "auto")
fork : bool (default: False)
return_string : bool (default: False)
|
|---|---|
| Returns : | pos : PropertyMap
gv : gv.digraph or gv.graph (optional, only if returngv == True)
|
Notes
This function is a wrapper for the [graphviz] routines. Extensive additional documentation for the graph, vertex and edge properties is available at: http://www.graphviz.org/doc/info/attrs.html.
References
| [graphviz] | (1, 2) http://www.graphviz.org |
Examples
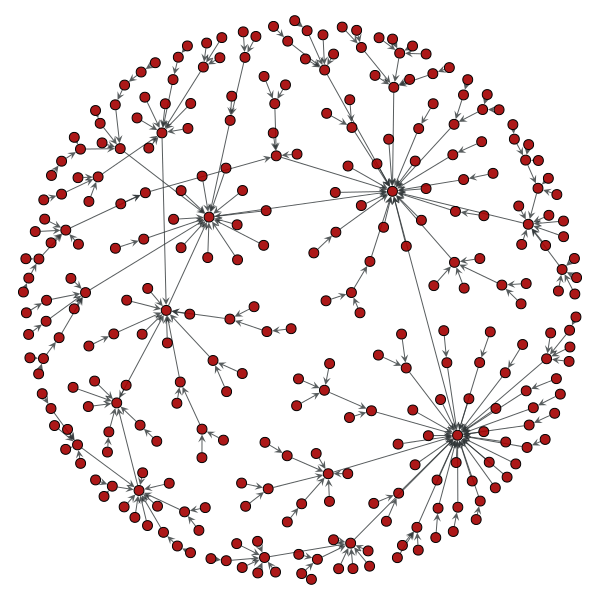
>>> g = gt.price_network(1500)
>>> deg = g.degree_property_map("in")
>>> deg.a = 2 * (sqrt(deg.a) * 0.5 + 0.4)
>>> ebet = gt.betweenness(g)[1]
>>> gt.graphviz_draw(g, vcolor=deg, vorder=deg, elen=10,
...                  ecolor=ebet, eorder=ebet, output="graphviz-draw.pdf")
<...>
Kamada-Kawai force-directed layout of a Price network with 1500 nodes. The vertex size and color indicate the degree, and the edge color corresponds to the edge betweeness centrality
Convert property map values to be more useful as a vertex size, or edge width. The new values are taken to be
If log=True, the natural logarithm of the property values are used instead.
Draw a graph to a cairo context.
| Parameters : | g : Graph
pos : PropertyMap
cr : Context
vprops : dict (optional, default: None)
eprops : dict (optional, default: None)
vorder : PropertyMap (optional, default: None)
eorder : PropertyMap (optional, default: None)
nodesfirst : bool (optional, default: False)
vcmap : matplotlib.colors.Colormap (default: matplotlib.cm.jet)
ecmap : matplotlib.colors.Colormap (default: matplotlib.cm.jet)
loop_angle : float (optional, default: nan)
parallel_distance : float (optional, default: None)
fit_view : bool (optional, default: True)
vertex_* : PropertyMap or arbitrary types (optional, default: None)
edge_* : PropertyMap or arbitrary types (optional, default: None)
|
|---|
Display an interactive GTK+ window containing the given graph.
| Parameters : | g : Graph
pos : PropertyMap (optional, default: None)
vprops : dict (optional, default: None)
eprops : dict (optional, default: None)
vorder : PropertyMap (optional, default: None)
eorder : PropertyMap (optional, default: None)
nodesfirst : bool (optional, default: False)
geometry : tuple (optional, default: (500, 400))
update_layout : bool (optional, default: True)
async : bool (optional, default: False)
**kwargs :
|
|---|---|
| Returns : | pos : PropertyMap
selected : PropertyMap (optional, only if output is None)
|
Notes
See documentation of GraphWidget for key bindings information.
Interactive GTK+ widget displaying a given graph.
| Parameters : | g : Graph
pos : PropertyMap (optional, default: None)
vprops : dict (optional, default: None)
eprops : dict (optional, default: None)
vorder : PropertyMap (optional, default: None)
eorder : PropertyMap (optional, default: None)
nodesfirst : bool (optional, default: False)
update_layout : bool (optional, default: True)
layout_K : float (optional, default: 1.0)
multilevel : bool (optional, default: False)
display_props : list of PropertyMap instances (optional, default: None)
display_props_size : float (optional, default: 11)
bg_color : str or sequence (optional, default: None)
vertex_* : PropertyMap or arbitrary types (optional, default: None)
edge_* : PropertyMap or arbitrary types (optional, default: None)
**kwargs :
|
|---|
Notes
The graph drawing can be panned by dragging with the middle mouse button pressed. The graph may be zoomed by scrolling with the mouse wheel, or equivalent (if the “shift” key is held, the vertex/edge sizes are scaled accordingly). The layout may be rotated by dragging while holding the “control” key. Pressing the “r” key centers and zooms the layout around the graph. By pressing the “a” key, the current translation, scaling and rotation transformations are applied to the vertex positions themselves, and the transformation matrix is reset (if this is never done, the given position properties are never modified).
Individual vertices may be selected by pressing the left mouse button. The currently selected vertex follows the mouse pointer. To stop the selection, the right mouse button must be pressed. Alternatively, a group of vertices may be selected by holding the “shift” button while the pointer is dragged while pressing the left button. The selected vertices may be moved by dragging the pointer with the left button pressed. They may be rotated by holding the “control” key and scrolling with the mouse. If the key “z” is pressed, the layout is zoomed to fit the selected vertices only.
If the key “s” is pressed, the dynamic spring-block layout is activated. Vertices which are currently selected are not updated.
Cleanup callbacks.
Reset the layout algorithm.
Perform one step of the layout algorithm.
Redraw the graph surface. If lazy is True, the actual redrawing will be performed after the specified timeout.
Redraw the widget.
Convert a position from the graph space to the widget space.
Convert a position from the widget space to the device space.
Apply current transform matrix to vertex coordinates.
Fit graph to window.
Init picked vertices.
Handle button press.
Handle button release.
Handle pointer motion.
Handle scrolling.
Handle key press.
Handle release event.
Interactive GTK+ window containing a GraphWidget.
| Parameters : | g : Graph
pos : PropertyMap (optional, default: None)
geometry : tuple
vprops : dict (optional, default: None)
eprops : dict (optional, default: None)
vorder : PropertyMap (optional, default: None)
eorder : PropertyMap (optional, default: None)
nodesfirst : bool (optional, default: False)
update_layout : bool (optional, default: True)
**kwargs :
|
|---|