| adjacency | Return the adjacency matrix of the graph. |
| laplacian | Return the Laplacian matrix of the graph. |
| incidence | Return the incidence matrix of the graph. |
Return the adjacency matrix of the graph.
| Parameters : | g : Graph
weight : PropertyMap (optional, default: True)
index : PropertyMap (optional, default: None)
|
|---|---|
| Returns : | a : csr_matrix
|
Notes
The adjacency matrix is defined as
In the case of weighted edges, the entry values are multiplied by the weight of the respective edge.
In the case of networks with parallel edges, the entries in the matrix become simply the edge multiplicities.
References
| [wikipedia-adjacency] | http://en.wikipedia.org/wiki/Adjacency_matrix |
Examples
>>> g = gt.collection.data["polblogs"]
>>> A = gt.adjacency(g)
>>> ew, ev = scipy.linalg.eig(A.todense())
>>> figure(figsize=(8, 2))
<...>
>>> scatter(real(ew), imag(ew), c=abs(ew))
<...>
>>> xlabel(r"$\operatorname{Re}(\lambda)$")
<...>
>>> ylabel(r"$\operatorname{Im}(\lambda)$")
<...>
>>> tight_layout()
>>> savefig("adjacency-spectrum.pdf")
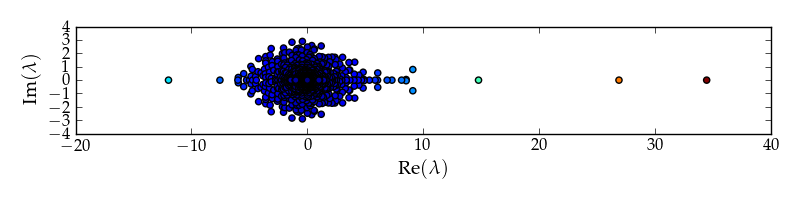
Adjacency matrix spectrum for the political blog network.
Return the Laplacian matrix of the graph.
| Parameters : | g : Graph
deg : str (optional, default: “total”)
normalized : bool (optional, default: False)
weight : PropertyMap (optional, default: True)
index : PropertyMap (optional, default: None)
|
|---|---|
| Returns : | l : csr_matrix
|
Notes
The weighted Laplacian matrix is defined as
Where \(\Gamma(v_i)=\sum_j A_{ij}w_{ij}\) is sum of the weights of the edges incident on vertex \(v_i\). The normalized version is
In the case of unweighted edges, it is assumed \(w_{ij} = 1\).
For directed graphs, it is assumed \(\Gamma(v_i)=\sum_j A_{ij}w_{ij} + \sum_j A_{ji}w_{ji}\) if deg=="total", \(\Gamma(v_i)=\sum_j A_{ij}w_{ij}\) if deg=="out" or \(\Gamma(v_i)=\sum_j A_{ji}w_{ji}\) deg=="in".
References
| [wikipedia-laplacian] | http://en.wikipedia.org/wiki/Laplacian_matrix |
Examples
>>> g = gt.collection.data["polblogs"]
>>> L = gt.laplacian(g)
>>> ew, ev = scipy.linalg.eig(L.todense())
>>> figure(figsize=(8, 2))
<...>
>>> scatter(real(ew), imag(ew), c=abs(ew))
<...>
>>> xlabel(r"$\operatorname{Re}(\lambda)$")
<...>
>>> ylabel(r"$\operatorname{Im}(\lambda)$")
<...>
>>> tight_layout()
>>> savefig("laplacian-spectrum.pdf")
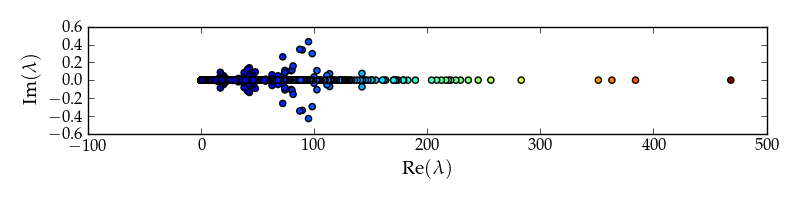
Laplacian matrix spectrum for the political blog network.
>>> L = gt.laplacian(g, normalized=True)
>>> ew, ev = scipy.linalg.eig(L.todense())
>>> figure(figsize=(8, 2))
<...>
>>> scatter(real(ew), imag(ew), c=abs(ew))
<...>
>>> xlabel(r"$\operatorname{Re}(\lambda)$")
<...>
>>> ylabel(r"$\operatorname{Im}(\lambda)$")
<...>
>>> tight_layout()
>>> savefig("norm-laplacian-spectrum.pdf")
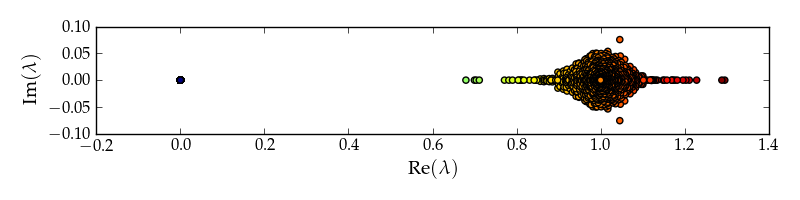
Normalized Laplacian matrix spectrum for the political blog network.
Return the incidence matrix of the graph.
| Parameters : | g : Graph
vindex : PropertyMap (optional, default: None)
eindex : PropertyMap (optional, default: None)
|
|---|---|
| Returns : | a : csr_matrix
|
Notes
For undirected graphs, the incidence matrix is defined as
For directed graphs, the definition is
References
| [wikipedia-incidence] | http://en.wikipedia.org/wiki/Incidence_matrix |
Examples
>>> g = gt.random_graph(100, lambda: (2,2))
>>> m = gt.incidence(g)
>>> print(m.todense())
[[-1. -1.  0. ...,  0.  0.  0.]
 [ 0.  0.  0. ...,  0.  0.  0.]
 [ 0.  0.  0. ...,  0.  0.  0.]
 ...,
 [ 0.  0. -1. ...,  0.  0.  0.]
 [ 0.  0.  0. ...,  0.  0.  0.]
 [ 0.  0.  0. ...,  1.  0.  0.]]